Some people are still adamantly convinced that something is crooked. Facebook is full of horror stories of high bills that just have to be wrong. Kristin Takeda of The Dallas Morning News seems to publish something on the subject every day or two. WFAA did an investigation into "skyrocketing water bills." And now the Dallas Observer reports on the phenomenon in the city of Dallas, not just once but twice.
Did any of these independent investigations turn up a widespread conspiracy by dozens of cities across north Texas to jack up water bills? Nope. Nobody uncovered anything other than the obvious. As Dallas Water Utilities Director Jody Puckett puts it, "Generally speaking, people have watered because it didn't rain. There's no nefarious conspiracy, there's no mid-year rate increase, there's no computer malfunction."
It seems to me that cities have been taking these complaints halfway seriously. They are responding to complaints by checking the accuracy of meters. They are checking homes for leaks. They are going over water usage history with homeowners.
I had my own pet theory for extremely high readings for a single month. What if meters aren't read every month? Could missed meter readings followed by catch-up readings put most of one summer's usage on a single bill, making it look more out of line than just normal high summer usage? More than one Facebook posting claimed that the City of Richardson's position is that every meter is read every month. That just seemed implausible to me. It may be the policy, but I doubt it's achievable every month. The Dallas Observer story reports, "Of the 300,000 water meters in the city of Dallas, Puckett guessed 5 percent weren't actually read in a given month." This seems more plausible to me and I consider it supporting evidence for my pet theory. So catch-up metering might explain some of the high water bills, but is it enough to explain all the discrepancies? Probably not. But it might get the number of puzzling cases down from a few percent to just an absolute few.
Still, you have to wonder about the cases where people swear they didn't change their watering habits at all. Or they were out of town all summer and didn't water. And their water bills still doubled or tripled. I don't see that cities are trying to get to the bottom of these cases. Of course, that requires homeowners meet the city halfway. Get their meters checked. Take their own meter readings, daily if necessary. Keep logs of their water usage habits -- when they water, how long, etc. Don't jump to conclusions. It might take months to get to the bottom of this. And when they do get to the bottom of it, tell us all on Facebook. Inquiring minds want to know.
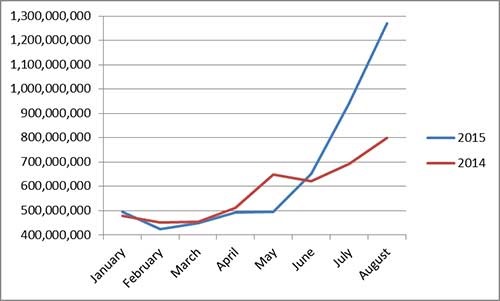
Below are the graphs I presented last month.
Here's how much water rates are going up. They increase each year, but steadily, not in one big jump. Even in ten years the total increase is still (just) below a tripling in rates.
 |
| Source: The Dallas Morning News. |
Here's how much usage has gone up. Now that's a jump, compared to May and compared to last year.
 |
| Source: City of Richardson. |
I promised you three graphs. Here's how much my own water bills and usage have gone up over the last four years.
 |
| Source: Personal records. |

No comments:
Post a Comment