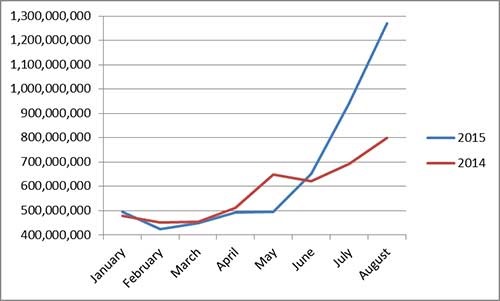
What would account for a 300% increase in water bills is increased usage. That that happened shouldn't be shocking. May was the wettest month in the area's history. We still had twice a month watering restrictions in place, although no one should have had to water their lawn at all. June and July were dry, dry, dry. And the water restrictions were eased. Twice weekly watering became the norm. Twice a month to twice a week is a fourfold increase. That and the change in weather means it's not surprising that water bills soared.
After the jump, three graphs that show the story.
Here's how much water rates are going up. They increase each year, but steadily, not in one big jump. Even in ten years the total increase is still (just) below a tripling in rates.
 |
| Source: The Dallas Morning News. |
Here's how much usage has gone up. Now that's a jump, compared to May and compared to last year.
 |
| Source: City of Richardson. |
I promised you three graphs. Here's how much my own water bills and usage have gone up over the last four years.
 |
| Source: Personal records. |
Some takeaways:
I have no idea what happened in September of 2013. I must have had a sprinkler party. Shock there...in my usage, not my bill.
Not counting that mysterious September, 2013, last month I had my highest water usage in three years and my highest water bill. No shock there.
My water bill went up 2.5x between May and August, but my usage went up 5x. No shock there. In fact, I think I got a bargain. Shhh. Don't tell the city.
My water bill went up 32% between last August and this August, but my usage went up 33%. No shock there. My bill tracks my usage.
My trend lines over three years show a slight dip in usage (I'm trying to conserve, I really am) and a slight rise in cost (caused by those 8-10%/year increases in rates, expected given the needed new infrastructure construction). No shocks there.

No comments:
Post a Comment